Obsah článku
If cryptocurrency trading catches on and you’re interested in technical analysis, you’ll need graphs and indicators. And this TradingView review can help with that.
Crypto exchanges usually give you a basic price chart, and that’s that. If you need to draw or show different indicators on your charts, you need to go elsewhere. And TradingView is probably the best place to direct your browser.
Getting started with TradingView.com
TIP: do you use a free tariff and want to be paid? I have a $30 discount for you.
The bottom line is create an account for the service remembers your settings and can be used across devices. You can also view and draw charts in them without logging on, but you will lose your data and your work when you close your browser.
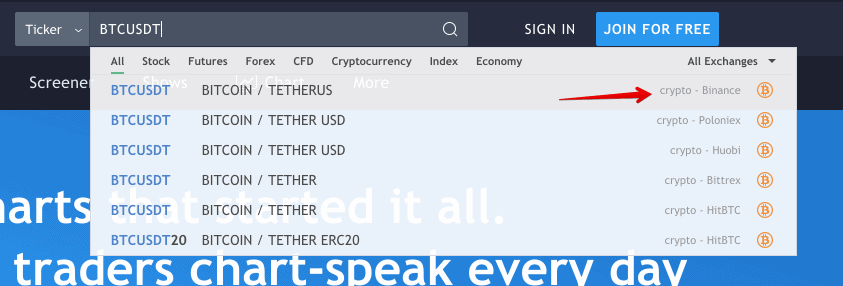
On the homepage you can search not only for cryptocurrencies by ticker or name, i.e. type BTC, or Bitcoin. The whisperer will immediately start offering you the pairs it has and the info on what stock market the data is from:
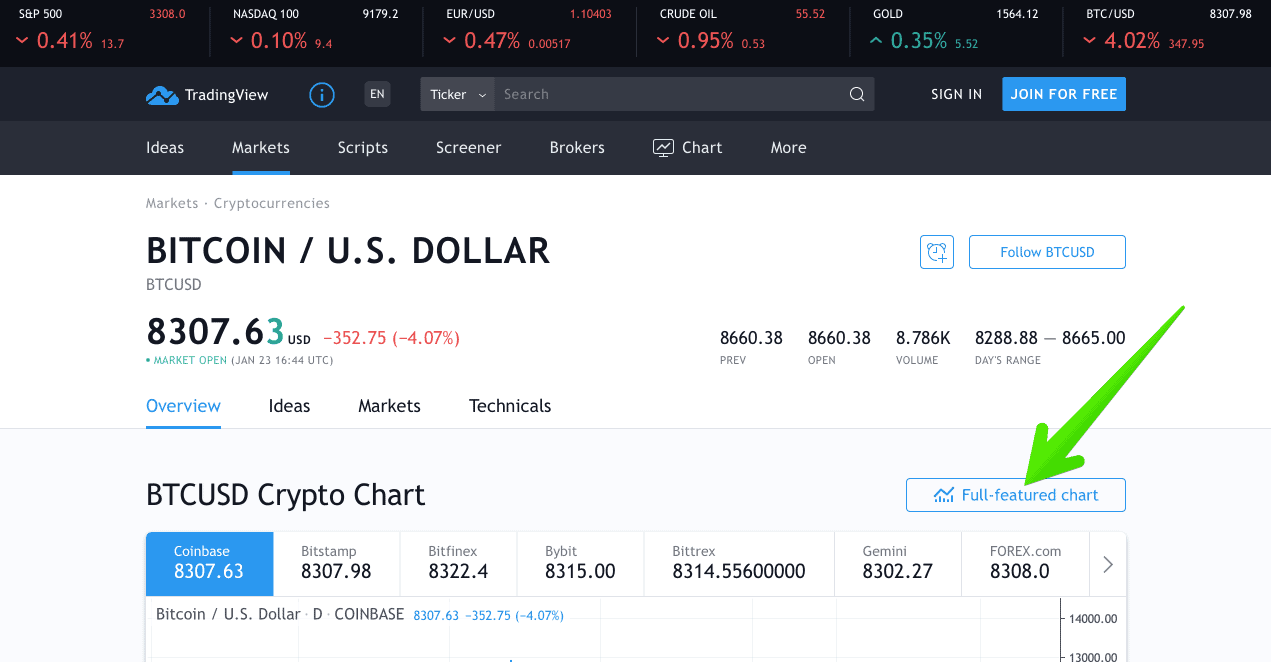
When you select the pair you are interested in, click on the Full-featured chart to take advantage of all the features the platform has to offer.
Firefish AKCE: půjčka bez poplatku
Jedinečná šance - první půjčku dostanete bez poplatku, který je běžně 1,5 % z částky.
Basic functions
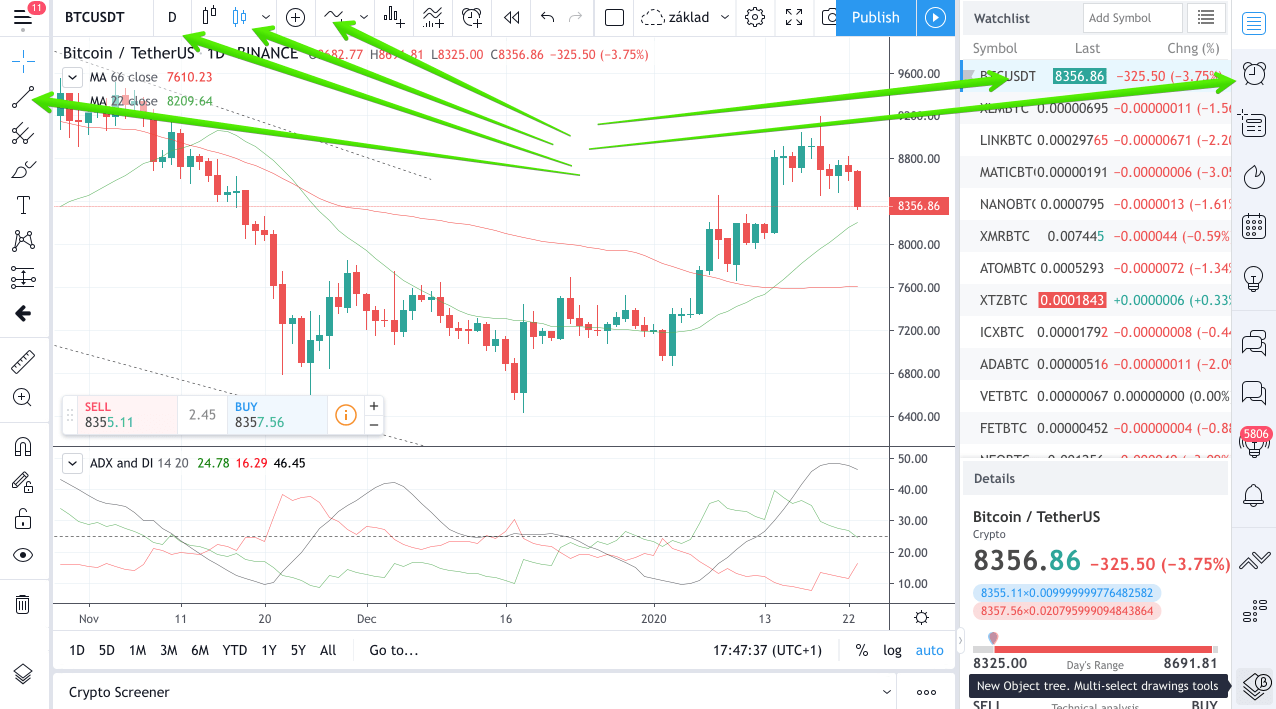
The great thing about TradingView is that it has so many features that you probably won’t even try them all. Everyone will find what they need for their strategies. From the way I use it, I came up with this list of the most important features:
Drawing trends on the chart
This option can be found in the left panel right at the top. You can draw different types of lines, each of which you can set to any thickness or color. After the initial excitement, you’ll probably find that it’s best to leave the lines at their default settings 🙂
Indicators and strategies
You’ll want to put an indicator on your chart to help you know when to buy and sell. You do this on the top bar with the plus button with the waveform. You can choose from lots of predefined and user-created indicators. I can confirm that I could find virtually any indicator in the menu that I had read about somewhere and wanted to see in practice. At the moment I use ADX a lot, which you can also find in the menu of course.

Selection of candles
In the same panel as the indicators, you will also find a selection of the candles you want to have on your chart. You can also switch to my favourite Heikin Ashi.
Timeframe settings
Third, you’ll probably use the timeframe toggle a lot on the top panel. You can choose from one second to one month, so you’ll definitely have your pick.
Watchlist
The penultimate place of interest is the right-hand side, where you will find a place to list your favourite coins or stocks. Simply search for a symbol and click to add it to your list. Next time, you can just conveniently click through the charts of your favorite commodities.
Alerts
The last control panel on the right side offers, among other things, alerts, which is a very handy thing. It is not in human power to keep an eye on all the signals if you are monitoring multiple commodities. Alerts allow you to set up notifications when something occurs. Setting up an alert knows what indicators you have on your chart and offers a straight setup based on some action on them. If a condition occurs, you may get an email, a popup in your browser, a push notification to your mobile app, and more. For me, mobile notifications are ideal.
Mobile app
TradingView offers a mobile app for both iOS and Android and I highly recommend using it. It’s almost unbelievable that the authors have stacked almost all the functionality from the desktop version into the mobile version as well. It’s not as convenient, of course, because mobile simply has a smaller screen and there’s nothing you can do about it. But you can do basic analysis and trace the signal to buy or sell on mobile without any problem. Of course, your account is synchronized, so you can see in the app what you see on your computer and vice versa.
The difference between the paid and free versions
The free version offers an incredible amount of „value for money“. The authors are probably well aware that even if they offer a lot of features for free, sooner or later they won’t be enough for most merchants and will turn into paying clients.
There are a lot of differences between the paid and free versions, if you are interested in details, check out the comparison of tariffs, but in a nutshell:
- free version „annoys“ you with advertising from time to time
- free version allows you to add only three indicators to the chart
- free version allows you to have only one active alert
- free version allows only one watchlist
There are three paid programs and the cheapest one costs 14,95 USD/month (12,95 USD for annual payment). I personally consider the alerts to be the killer feature to get you to pay. You won’t make a dent in the world with one alert and you’ll have to watch everything manually. Alerts make you pay sooner or later 🙂
All paid options have a free month to try, so there is no reason to hesitate. Try free paid version and see if you end up wanting to pay or if you can get by with the free version. And beware, once you activate the trial version of the paid plan, you’ll receive a 50% discount in the mail when you pay annually.
PS: if you don’t have a discount offer, use this link to get $30 off 🙂
Bitcoinvkapse is created mainly in Czech. This is an English translation of one of the many Czech articles. Czech version is here.
Čtěte dále:
- Firefish Review 2026: Bitcoin-Backed Loans Without Selling Your BTC [REVIEW]
- DCA Bitcoin Savings with Invity Turbo [Review + Lifetime Fee Discount]
- Jak na grafy s Tradingview.com – recenze
Líbil se ti článek? Ukaž jak moc 😉
1. Zvol částku · 2. Klikni na „Poslat přes Lightning"
Naskenuj QR mobilní Lightning peněženkou
nebo pošli přímo na: Nevím, která bije
powered by DonateBySatoshi